AWS CloudWatch Observability Solutions: Game-Changer or Just a Glossy Wrapper? Honest First Impressions!
This blog is little unusual than the usual “show-what-you-built” blogs which we usually see for cloud services and new features on the internet.
In this blog I will sharing my first impressions, good and bad points about the new update on Cloudwatch: Observability Solutions !!!
AWS CloudWatch Observability Solutions aim to simplify monitoring setup with pre-configured tools for AWS services and workloads. But is it really that straightforward? Let’s explore the reality!
Motivation
- Nov 15, 2024 AWS released a new feature for cloudwatch and it goes like this.
Observability solutions simplify infrastructure and application monitoring on AWS, providing developers with guided, ready-to-use examples for AWS services, custom apps, and third-party workloads. They include instrumentation, telemetry, custom dashboards, and metric alarms.
You can choose from a catalog of solutions tailored for workloads like JVM, Kafka, Tomcat, or NGINX, covering tasks such as CloudWatch agent setup, pre-defined dashboards, and alarms.
These solutions also offer guidance on features like Detailed Monitoring, Container Insights, and Application Signals, and support Amazon CloudWatch and Amazon Managed Service for Prometheus. Deploy them as-is or customize based on your needs.
Navigating to Observability Solutions in CloudWatch Console 😓
- I feel finding observability solutions in console is not tricky but can be easily overlooked because it only appears in the Home Screen.
I said easily overlooked because people usually directly navigate to alarms, logs or metrics etc on left pane and even in that pane there is no mention of observability solutions.
- There is even no mention in the what’s new as of writing this blog.
Observability Solutions Catalogue 🤩
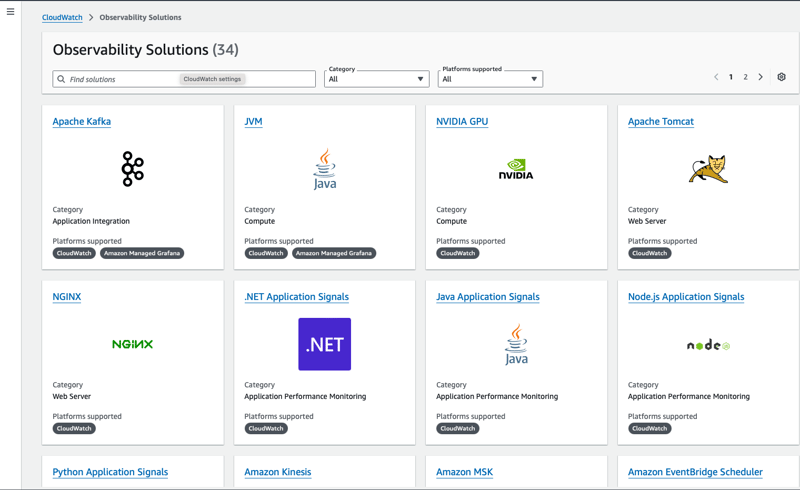
- As of Today (18,Nov 2024) Observability solution supports around 34 services Catalogue.
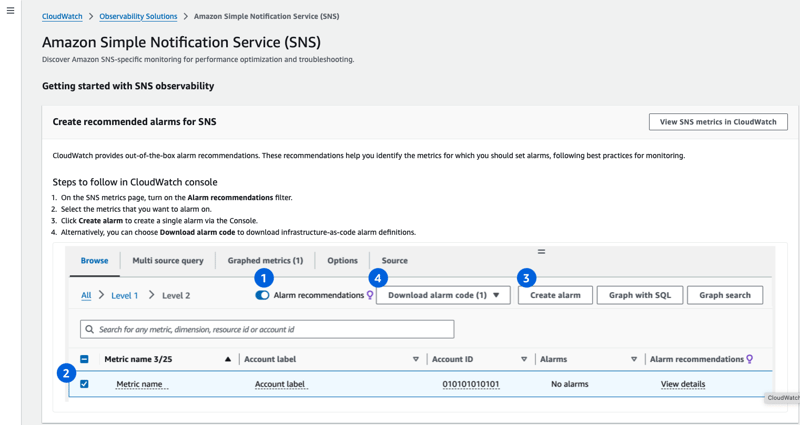
- You can click on Any service and see what kind of Observability Solution it offers.
Things I Don’t Like about this Update 😞
Wrapping Existing features as a Solution
- Observability Solutions cover various monitoring tasks but almost all the services covers one common solution which is Create recommended alarms.
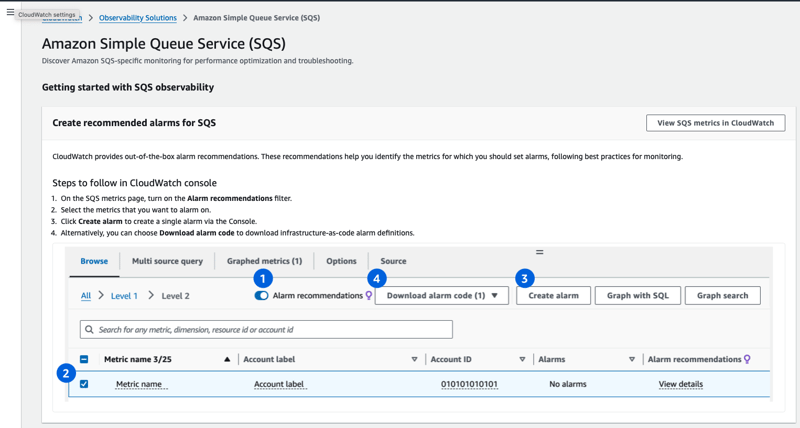
- The reason I don’t like this about this that this feature already exists a year back (20, Dec 2023)
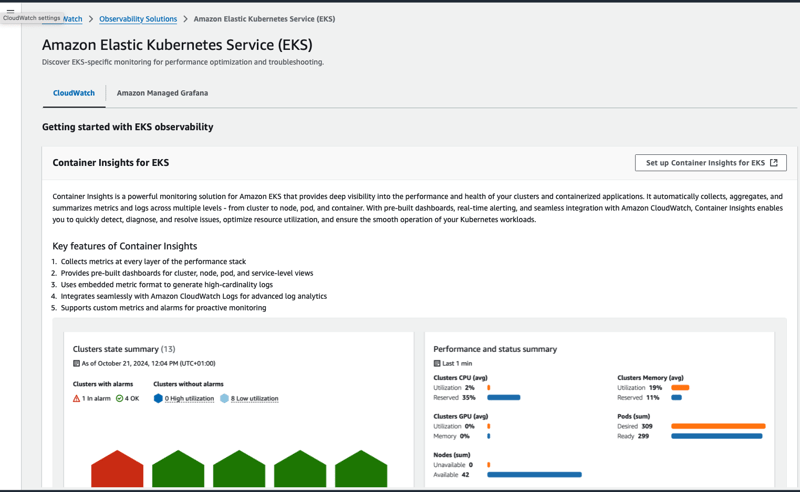
- Even container insights for EKS existed long back.
Things I Like About this Update ❤️
Documentation is crisp and clear
- https://docs.aws.amazon.com/AmazonCloudWatch/latest/monitoring/Monitoring-Solutions.html
- I really love the way how documentation for various solutions is designed and presented giving a clear picture on where you will incur cost, what specific metrics you can expect, advantages of the solution, various configuration and how to deploy those configuration.
Note: It is vital to understand any solution you use creates and uses resources in your account so you will be charged hence it is important to check for Costs section in the particular solution documentation to avoid unexpected costs.
Pre-defined customer dashboards
- The dashboards are pretty self explanatory and team has gone ahead to even explain how to use and interprets the dashboard
Observability Solutions around Ec2
- The solutions built around EC2 for workload like JVM, NGINX, Kafka, NVIDIA, tomcat provides out-of-the-box telemetry collection for the mentioned workloads. Additionally, it helps you set up pre-configured dashboards.
- I think this would really help users to gain more visibility in their observability, plus giving them assurance that their solution adheres to AWS Best practices.
Obserability solutions using Amazing Managed Grafana
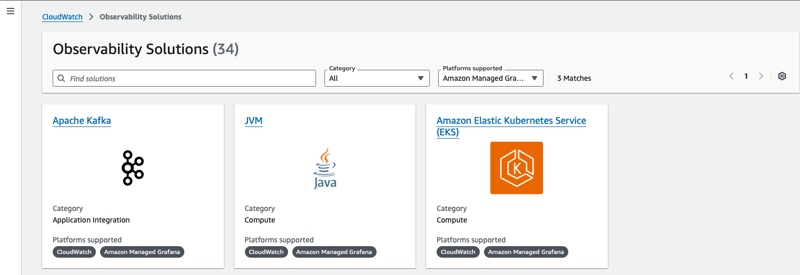
- Though Catalogue screen says it supports JVM, Kafka but at the writing of this blog only EKS supports AMG based Observability solution.
- Monitoring Amazon Elastic Kubernetes Service infrastructure is one of the most common scenarios for which Amazon Managed Grafana are used. In simple words, It provides Automated Telemetry through pre-configured agentless scraper. Expert recommended monitoring practices. Pre-configured Grafana dashboards for EKS infrastructure.
More detail analysis of AMG based EKS observability solution
The solution offers both proactive and reactive capabilities:
- Proactive capabilities:
- Optimize resource usage by making better scheduling decisions, like allocating enough CPU and memory for reliable Amazon EKS workloads based on historical data.
- Forecast future resource needs for planning, such as scaling for a new project similar to existing workloads. Spot potential issues early by analyzing trends, like workload usage patterns in Kubernetes namespaces.
- Reactive capabilities:
- Quickly detect infrastructure or workload issues with tools like troubleshooting dashboards.
- Pinpoint problem areas in the stack, such as API server overloads impacting Kubernetes operations, even though the EKS control plane is managed by AWS.
As per docs this solution sets up the following resources and it can be set up by either using AWS CDK or terraform:
- Prometheus Workspace: Stores metrics from your Amazon EKS cluster using a managed collector to gather and send data.
- CloudWatch Logs: Collects EKS cluster logs via a CloudWatch agent, which Amazon Managed Grafana queries for analysis.
- Grafana Workspace: Integrates metrics and logs to create dashboards and alerts for monitoring your cluster.
The resulting dashboards and alerts will:
- Monitor overall EKS cluster health.
- Track the health and performance of the EKS control and data planes.
- Provide insights into workloads across Kubernetes namespaces.
- Show resource usage like CPU, memory, disk, and network across namespaces.
How I wished Observability Solutions to be 🙏
Its good with AMP based observability solution on EKS there is way to deploy using IaC (CDK or terraform) but it would be far easy if I can manage this using an EKS add-on. If idea is to give AWS best-practices then why not simplify even further?
Most of the observability solutions like setting up recommended alarms already exist and I think observability solution is like a wrapper or umbrella to push it as observability solutions. But I still need to enable it manually by going to cloudwatch metrics of particular service. Why not allow users to enable it right from the same screen by just a single button?
If the idea was to provide opinionated guidance about the best options for observing AWS services, custom applications, and third-party workloads then why not push AWS observability Catalogue as centralized dashboard for used services in the account to enable users to identify or provide information whether they are using AWS best practices for observability or not.
Right now There is no way to track whether I am using observability solution provided by aws just by looking at observability catalogue.
Conclusion
- After understanding AWS Observability solutions I feel at this moment they really outshine for EC2 workloads and Amazon Managed Grafana solutions for EKS as it really embody the idea go providing AWS best practices for observability. ✅
- I feel Observability Catalogue still needs some updates so that users can treat it as central page to track their Observability solutions across AWS for various AWS services being used. ❌
- I also feel Observability Solutions*_ need to come up with a way to simplify implementation of various solutions as one click deployment/customize solutions as needed_* as I still feel implementing a solution is still a very manual process.❌
What do you think about CloudWatch Observability Solutions?
